
BLOOD FILM OR SMEAR
EXAMINATION
Making and staining
blood films or smear
Examination of the blood
film is an important part of the hematologic evaluation. The reliability of the
information obtained depends heavily on well–made and well stained films which
are systematically examined. So, the production of a good stained film is an
absolute requirement if one hopes to obtain all information possible from the
morphology of blood cells.
Blood smears or films can
be made on glass slides or coverslips. The latter have the single possible
advantage of a more even distribution of the leukocytes, but in every other
respect slides are to preferred. Unlike coverglasses, slides are not easily
broken; they are simple to label and when large number of films are to be dealt
with, slides will be found much easier to handle.
Methods:
A. The two–slide or wedge method
This
is the simplest and most widely used method. It uses two slides, one for the
smear and the other serves as spreader or pusher.
Criteria
of a good blood smear using two–slide or wedge method
1. The thick area makes a gradual
transition to the this area (feathery like edge)
2. The blood on the thin area does
not extend to the end of the slide – the smear may cover ¾ of the slide’s
length
3. Must have smooth even surface,
free from ridges, waves and holes
4. Leukocytes must not be bunched at
the edge or at the end of the smear.


B. Ehrlich’s two–coverglass method
No.1
or 1 ½ coverglasses 22 mm square are recommended. In this method, the
coverglass with blood side down is placed crosswise on another coverglass so
that the corners appear on an eight pointed star. When the blood has spread
evenly between the two surfaces, pull the coveglasses quickly but firmly apart
on a plane parallel to their surface.

C. Beacom’s coverglass and slide method
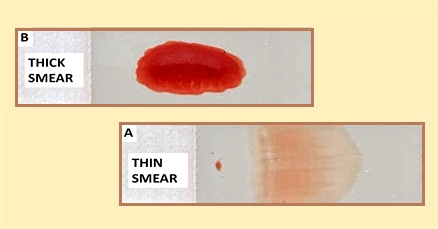
THE THIN AND THICK
SMEAR
1. Thin smears are prepared by any of the three methods previously
mentioned. These smears are used for
a. Differential leukocyte count
b. Stained red cell examination
c. Platelet count (indirect method)
d. Reticulocyte count
e. Siderocyte count
f. Malarial parasite (blood
parasite) examination
g. Thorough study of the morphology
of blood cells
2. Thick smears are prepared as follows:
a. Place a small drop of blood in
the center of a slide
b. Spread it out with a corner of
another slide to cover an area about 4 times its original area
c. The correct thickness for a
satisfactory film will be achieved if, with the slide placed on a piece of
newspaper, small print is just visible
Thick
smears are used in:
a. Diagnosis of malaria
b. Diagnosis of filarial
c. Diagnosis of trypanosomes
d. Diagnosis of spironemas
Factors
which affect the thickness of blood films:
a. Variation in the angle of the
spreader
b. Variation in the pressure of the
spreader against the slides
c. Variation in the size of the drop
of blood
Requirements
to be able to produce proper blood films:
a. Use of chemically clean slides
and coverglasses
b. Use of not too large nor too
small drop of blood
c. Work is done quickly before
coagulation of blood
d. Proper angle and pressure of the
spreader
Methods
of drying the film
a. Air drying
b. Heating in the oven or at low
flame
c. Chemical drying in ethyl alcohol
Chemicals
used to fix blood smears
a.
Pure methyl alcohol
b.
Absolute ethyl alcohol
c.
Absolute alcohol and ether
d.
1% solution of HgCl2
e.
1% formalin
STAINING OF BLOOD
SMEARS
The microscopic study of
stained, peripheral blood smear constitutes the most important part of the
routine hematological examination. Cytochemical stains are essential for the
identification of hemopoeitic cells. The most commonly used stains are
polychrome stains; those belonging to the Romanowsky group.
A polychrome stain is a
stain of many colors and the original polychrome stain was discovered by
Romanowsky. Polychrome methylene blue and eosin stains are the outgrowth of the
original time–consuming Romanowsky method and are widely used. They stain
differently most normally and abnormal structures in the blood.
All Romanowsky stains are
composed of mixture of thiazine eosinate produced by the interaction of
polychrome methylene blue with eosin. The neutral dye precipitated is
redissolved in methyl alcohol and used as stain; the difference among the
various stains in the proportion of the reagent and in the method of
preparation.
Methylene blue on
oxidation produces colored compounds, termed “azures” which have the ability to
combine with eosin. Oxidation of methylene blue is known as “polychomasia” or
“polychroming,” it may be formed by heating for 12 hours at 65oC and
allowing it to be exposed to atmospheric oxygen for 10 days or by accelerating
the oxidizing action by allowing it to be exposed to free steam. When the
Romanowsky stains color the cellular constituents blue or purple, they are
termed basophilic. They stain red, pink or orange, they are said to be
acidophilic or oxyphilic or eosinophilic. Those cellular constituents staining
between the two extremes are termed neutrophilic.
PRINCIPLES IN STAINING
Physical theories of
staining assume that the dye either precipitates the porous cellular wall or is
consequently absorbed into the cell or that the stain is precipitated within
the cell after such penetration. The proponents of the chemical theory of staining
postulate that because of the nuclear material is composed primarily of DNA and
consequently acidic in nature, it has an affinity for basic dyes and that the
cytoplasm is normally basic in pH and has an affinity for acidic dyes. This
theory also assumes that the tissue acids and bases are amphoteric and act as
electrolytes dissolved in any solution in which they are immersed. Stains for
blood are used at a pH of either 6.4 to 6.8, depending on the stain used; at
those pH levels the nuclei takes basic stains and the cytoplasm, acidic dyes.
Bone marrow are usually better stained at a pH of 6.4, while malarial parasites
at a pH of 7.2.
Basically, the procedure of staining with
Romanowsky stains consists of flooding the smear with stain, which allows the cells
to be fixed by the alcohol vehicle, staining the cell by the addition of water
to the stain and finally removing the excess stain from the cells by
differentiating with water. The staining period must be rigidly monitored
otherwise the smear may appear understained, overstained, too acidic or too
alkaline.
Note: Romanowsky stains are dissolved in methyl
alcohol and combine fixation with staining
1. Wright stain
In
its preparation, the methylene blue is polychromed by heating with sodium
bicarbonate
Formula: Wright stain – 0.1 grams
Methyl alcohol – 60 ml
Preparation
of buffer (pH 6.4)
Primary potassium phosphate
(monobasic) – 6.63 grams
Secondary sodium phosphate (dibasic)
– 2.56 grams
Distilled water – 1 liter
2. May–Grunwald’s stain
May
– Grunwald’s powdered dye – 0.3 grams
Methyl
alcohol – 100 ml
3. Giemsa stain
Giemsa
powdered dye – 1 gram
Glycerol
– 66 ml
Methyl
alcohol – 66 ml
4. Leishman’s stain
Leishman’s
powdered dye – 0.2 grams
Methyl
alcohol – 100 ml
5. Jenner’s stain
Jenner’s
powdered dye – 0.5 grams
Methyl
alcohol – 1 liter
6. May–Grunwald – Giemsa stain
Both
May – Grunwald and Giemsa stain are covered on the blood films one after the
other
Panoptic stain – a combination of a Romanowsky stain and another stain to improve
cytoplasmic granules. Examples: (a) Jenner–Giemsa stain (b) May–Grunwald –
Giemsa stain
Intravital stain – it is used to stain the tissue by a dye which is
introduced into a living organism and which, by virtue of selective attraction
to certain tissues, will stain these tissues.
Supravital stain – a supravital stain is used to stain and inspect
living cells which have been removed from the body. The stain enables the cells
to remain alive and mobile. It does not stain the nucleus or cytoplasm but is
stain significant structures in the cytoplasm. Example is the reticulocyte
stain.
CRITERIA OF A GOOD
STAIN
1. The film will appear pink to the naked eye.
2. Microscopically, the erythrocyte are pink
3. The neutrophilic granules are lilac
4. The eosinophilic granules are red
5. The nuclei of WBC are purplish blue
6. The oxychromatin of the nuclei are clearly differentiated
7. The areas between the cells are clear with no film or precipitated
stain visible
Causes of overstained
smears
1.
Too thick smears
2.
Insufficient washing
3.
Too prolonged staining time
4.
Excessive alkalinity of the stain, buffer or water
Appearance of cells in
overstained smears
1.
Erythrocyte stains blue or green
2.
Cytoplasm of the lymphocytes become gray or lavender
3.
Granules of neutrophils are intensely overstained
4.
Eosinophilic granules become deep gray or blue
Causes of under stained
smears
1.
Too thin smears
2.
Excessive washing of the smear
3.
Excess acidity of the stain, buffer or water
Appearance of cells in
understained smears
1.
Nuclear chromatin is stained pale blue rather than vivid blue
2.
Erythrocyte stain bright red or orange rather than pink
3.
Eosinophilic granules stain brilliant red
Causes of scum or
precipitated stain between the cells
1. Unclean slide or coverglass
2. Faulty washing because of failure to hold the slide horizontally and to
float off the scum
3. Permitting dust to settle on the film
Causes of poor staining
1.
Alkaline slides and alkaline distilled water
2.
Acid slides and acid distilled water
3.
Unclean slides
4.
Evaporation of the stain
5.
Incorrect buffer pH
6.
Imperfect polychroming of the stain
7.
Incomplete reaction of the staining fluid
8.
Errors of the operator
**** DIFFERENTIAL LEUKOCYTE COUNT ****
Differential leukocyte
count is the linear representation of the percentage of the various types of
leukocytes in the peripheral or venous blood. It is called “hemogram.”
Steps in making a
differential leukocyte count
1.
Making the blood smear
2.
Staining the blood smear
3.
Counting the cells
4.
Reporting the result
Methods or techniques
employed in counting the cells:
1. Strip differential count
All
the cells are counted in the longitudinal strip that is, from the head to the
tail of the smear.
2. Exaggerated battlement method
The
count starts at one edge of the smear and counting all the cells, advancing
inward to 1/3 of the width of the smear, then on the line parallel to the edge,
then out of the edge, then along the edge.
3. Two–field meander method
The
count is made by dividing the smear into two fields and proceeds as in
exaggerated battlement method
4. Four–field meander method
The
count is made by dividing the smear into four fields and proceeds as in
exaggerated battlement method
Methods of
classification of cells in differential count
1. Schilling hemogram
In
this method, all the leukocytes (granulocytes and non–granulocytes) are
classified and grouped according to maturity of the cells into:
Granulocytes: Neutrophils, Eosinophils, Basophils
Non–granulocytes: Lymphocytes,
Monocyte
The
polymorphonuclear neutrophils are further classified according to maturity of
the cells as:
a.
Myelocytes
b.
Metamyelocytes
c.
Bands or stabs
d.
Segmenters
The
Schilling hemogram may be represented as:
Basophil 0.25 – 0.5%
Eosinophil 2 – 4%
Myelocyte 0%
Metamyelocyte 0 – 1%
Stab 2 – 6%
Segmenters 55 – 65%
Lymphocytes 25 – 35%
Monocytes 2 – 8%
2. Arneth’s classification
In
this method, the polymorphonuclear neutrophils are classified according to the
number of lobes which their nuclei possess. The more lobes, the older the
cells:
Class
I (with lobe or indented nucleus) –
5%
Class
II (with 2 lobes) –
35%
Class
III (with 3 lobes) – 41%
Class
IV (with 4 lobes) –
17%
Class
V (oldest with 5 lobes) –
2%
Under
the traditional unit, the result in differential leukocyte count is reported in
percentage, under the S.I. unit, the proportion of each type of cell is
reported as a decimal fraction and is called the leukocyte type number
fraction.
3. Haden’s classification
This
method classifies the neutrophils according to the presence of filaments. These
neutrophils whose lobes are connected by thin filaments are classified as
filamented, while those that are not connected by filaments are grouped under
non–filamented cells.
Filamented
cells – 60%
Non–filamented
cells – 7%
Eosinophils
– 3%
Basophils
– 1%
Lymphocytes
– 21%
Monocytes
– 8%
SHIFTING PROCESSES:
Shift to the left – if there is an increase in younger forms of
leukocytes particularly Classes I and II. Seen in pyogenic infections.
Shift to the right – if there is an increase in older forms of
leukocytes particularly Classes IV and V. seen in megaloblastic anemia and in
convalescence
Regenerative shift to
the left – if the predominating cells
are younger forms, with the presence of myelocyte and metamyelocytes and
increase in band cells; and it is accompanied by a high leukocyte count
Degenerative shift to
the left – if the predominating cells
are younger forms, with an increase in band cells but without myelocyte and
metamyelocytes; and it is accompanied by a low WBC count.
NORMAL DIFFERENTIAL WBC
COUNT VALUES
Segmented neutrophils – 50 – 70%
Stabs or bands – 5 – 16%
Eosinophils – 2 – 4%
Basophils –
0 – 1%
Monocytes – 2 – 6%
Lymphocytes – 20 – 35%
AUTOMATED DIFFERENTIAL
LEUKOCYTE COUNT
Two general principle have
been employed in the automation of differential leukocyte count
1. Digital image processing – a uniformly made and stained blood film is placed
on a microscope stage, which is driven by a motor. A computer controls the
movement, scanning the slide and stopping it when leukocytes are in the field.
The optical images are then recorded by television camera, analyzed by computer
and converted to digital form.
2. Flow–through system – these systems analyze the cells suspended in a liquid. In photo–
optical system, measurements of light scattering and of light absorption are
made while the cells are being counted.
No comments:
Post a Comment